

Categories
new blog
- A Technical Roadmap from Battery Lab Line and Pilot Line to Full-Scale Battery Production Line Solutions
- TOB NEW ENERGY: China Integrated Battery Solutions Supplier Equipment and Materials to Turnkey Production Lines
- TOB Senior Engineer Appointed CSU Industry Graduate Mentor
- Solid-State Battery Manufacturing Equipment Guide 2026–2027
- Supercapacitors vs Batteries: Complementary Industrial Energy Storage
Tags
Electrochemical Performance Test of High-quality Fe4[Fe(CN)6]3 Nanocubes
High-quality Fe4[Fe(CN)6]3 Nanocubes Preparation: As Cathode Material for Aqueous Sodium-ion Battery
WANG Wu-Lian. High-quality Fe4[Fe(CN)6]3 Nanocubes: Synthesis and Electrochemical Performance as Cathode Material for Aqueous Sodium-ion Battery. Journal of Inorganic Materials[J], 2019, 34(12): 1301-1308 doi:10.15541/jim20190076
Electrochemical Performance Test of High-quality Fe4[Fe(CN)6]3 Nanocubes
First, the electrochemical performance of HQ-FeHCF and LQ-FeHCF in Na-H2O-PEG electrolyte was tested using a three-electrode system. Figure 4(a) shows the cyclic voltammetry curves of HQ-FeHCF and LQ-FeHCF in Na-H2O-PEG electrolyte with a scan rate of 1 mV s-1. It can be clearly observed from the figure that two pairs of independent redox peaks appeared in HQ-FeHCF, indicating that two redox reactions occurred, corresponding to the reversible intercalation/deintercalation of two Na+. The first pair of redox peaks appeared at 0.03 and 0.28 V, corresponding to the reduction and oxidation of high-spin FeIII/FeII ions attached to carbon atoms. The second pair of redox peaks appears at 1.12 and 1.26 V, corresponding to the reduction and oxidation of low-spin FeIII/FeII ions bonded to nitrogen atoms. At the same scan rate, the CV curves of LQ-FeHCF and HQ-FeHCF are similar.
Figure 4(b) shows the constant-current charge-discharge curves of HQ-FeHCF and LQ-FeHCF at 1C (1C= 120 mA g-1) rate. It can be clearly seen from the figure that HQ-FeHCF has two voltage plateaus during the charging and discharging process, indicating that the insertion/extraction of Na+ is completed in two steps. This corresponds to the two pairs of redox peaks appearing in Fig. 4(a). LQ-FeHCF shows similar charge-discharge curves to HQ-FeHCF, but its discharge capacity is significantly smaller than that of HQ-FeHCF.
Figure 4(c) shows the rate performance of HQ-FeHCF and LQ-FeHCF. It can be seen from the figure that the specific capacities of HQ-FeHCF at 1C, 2C, 5C, 10C, 20C, 30C and 40C rates are 124, 118, 105, 94, 83, 74 and 63 mAh·g-1, respectively. It is worth noting that when returning to 1C again, the capacity recovered to 124 mAh·g-1, showing excellent rate performance. There are two reasons why HQ-FeHCF has such a good rate performance: First, the HQ-FeHCF material synthesized by the method in this paper has high quality and few vacancy defects, thus ensuring the efficient transport of Na+. Second, the large channel structure of the material shortens the Na+ transport path. In addition, the structure of HQ-FeHCF slowly synthesized by adding PVP is very stable, and high-rate charge-discharge cycles will not lead to the structural collapse of HQ-FeHCF, resulting in the degradation of electrochemical performance. The specific capacities of LQ-FeHCF at 1C, 2C, 5C, 10C, 20C, 30C and 40C rates are 112, 104, 81, 59, 35, 18 and 7 mAh·g-1, respectively. The overall rate performance is worse than that of HQ-FeHCF, especially at high rates, the gap is particularly obvious. This is because LQ-FeHCF has no stable structure, and there are a large number of [Fe(CN)6] vacancy defects and crystal water in its crystal, which hinder the deintercalation of Na+, resulting in the extremely low specific capacity of LQ-FeHCF at high magnifications.
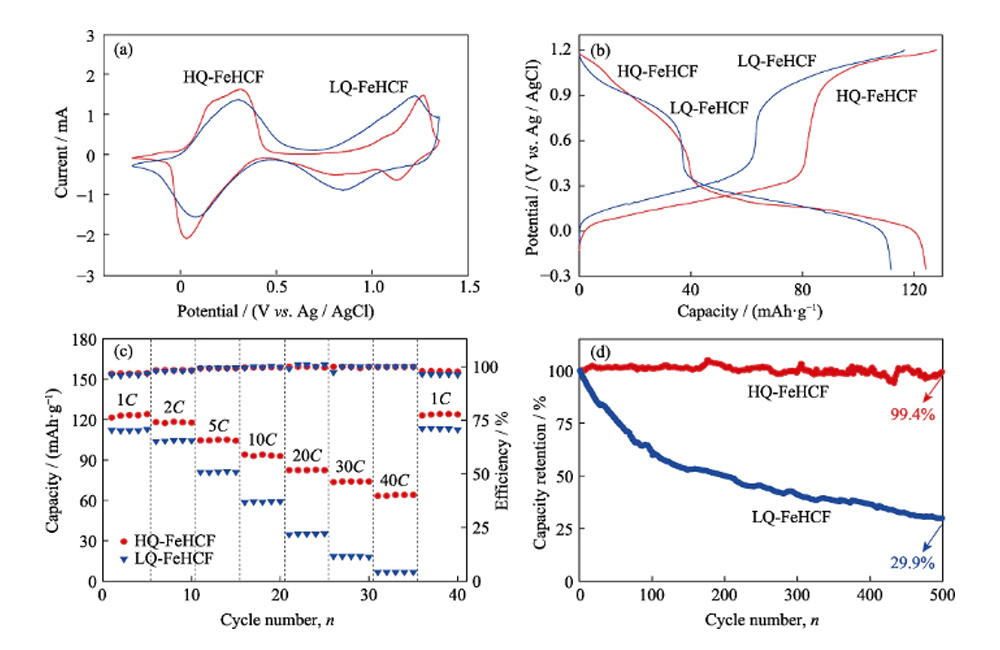
Fig. 4 (a) Cyclic voltammogram (CV) curves of HQ-FeHCF and LQ-FeHCF at the sweep rate of 1 mV·s-1 in the electrolyte of Na-H2O-PEG; (b) Charge and discharge curves of HQ-FeHCF and LQ-FeHCF at 1C; (c) Rate performance of HQ-FeHCF and LQ-FeHCF; (d) Cycling performance of HQ-FeHCF and LQ-FeHCF
Cycling stability is an important parameter for aqueous Na-ion batteries in practical applications. The cycling performance of HQ-FeHCF and LQ-FeHCF at 5C rate is shown in Fig. 4(d). The discharge capacity of LQ-FeHCF in the first cycle is 87 mAh·g-1, but its capacity decreases rapidly with the increase of cycle times. After 100 cycles, the capacity retention rate was 61%, and after 500 cycles, the capacity was only 26 mAh·g-1, corresponding to a capacity retention rate of 29.9%. HQ-FeHCF shows extremely excellent cycle stability. After 100 cycles, the capacity of HQ-FeHCF did not decrease significantly, maintaining a capacity retention rate of 100%, and the capacity retention rate was still as high as 99.4% until the 500th cycle.
In order to further verify the stability of HQ-FeHCF in Na-H2O-PEG electrolyte, the electrodes after 100 cycles and 500 cycles were observed by SEM. As shown in Figure 5, Figure 5(a~b) is the SEM photo of HQ-FeHCF in Na-H2O-PEG electrolyte after 100 times of constant current charge and discharge at 5C. It can be clearly seen from the figure that each HQ-FeHCF nanocube particle maintains a high degree of integrity, almost no structural damage, and no defects on the particle surface. Figure 5(c~d) are SEM photos of HQ-FeHCF in Na-H2O-PEG electrolyte after 500 constant current charge and discharge at 5C. Each HQ-FeHCF nanocube particle also maintains a high degree of integrity without any structural deformation or collapse. The pole piece after 500 cycles was subjected to TG test, as shown in Figure 6. The crystallization water content of HQ-FeHCF was 13%, no significant change compared with before cycling; the crystal water content of LQ-FeHCF was 20%, an increase of 2% compared with before cycling.
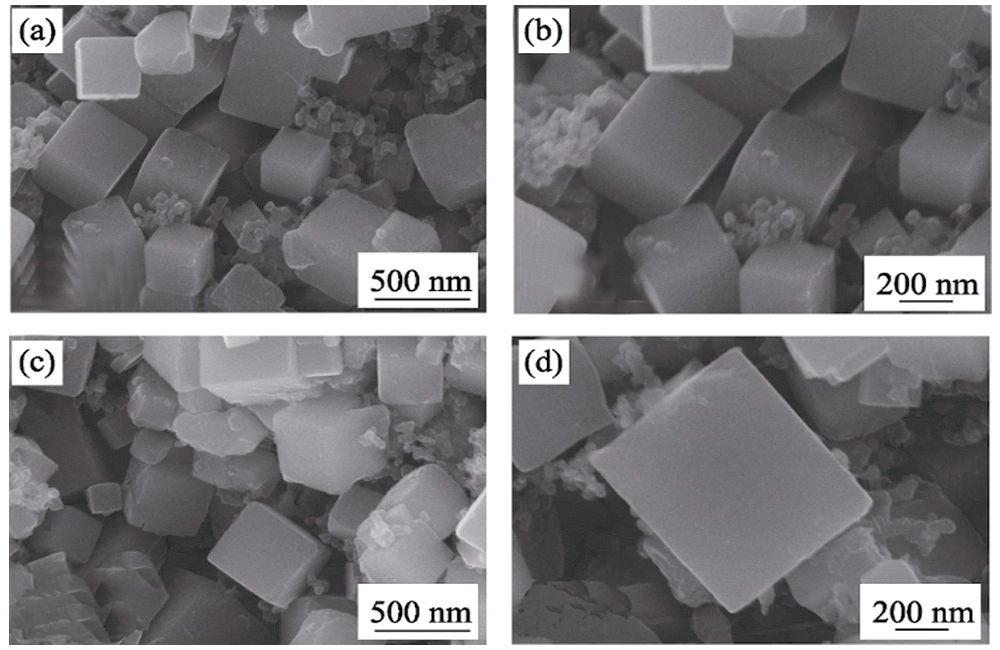
Fig. 5 SEM images of HQ-FeHCF after (a-b)100 and (c-d) 500 cycles
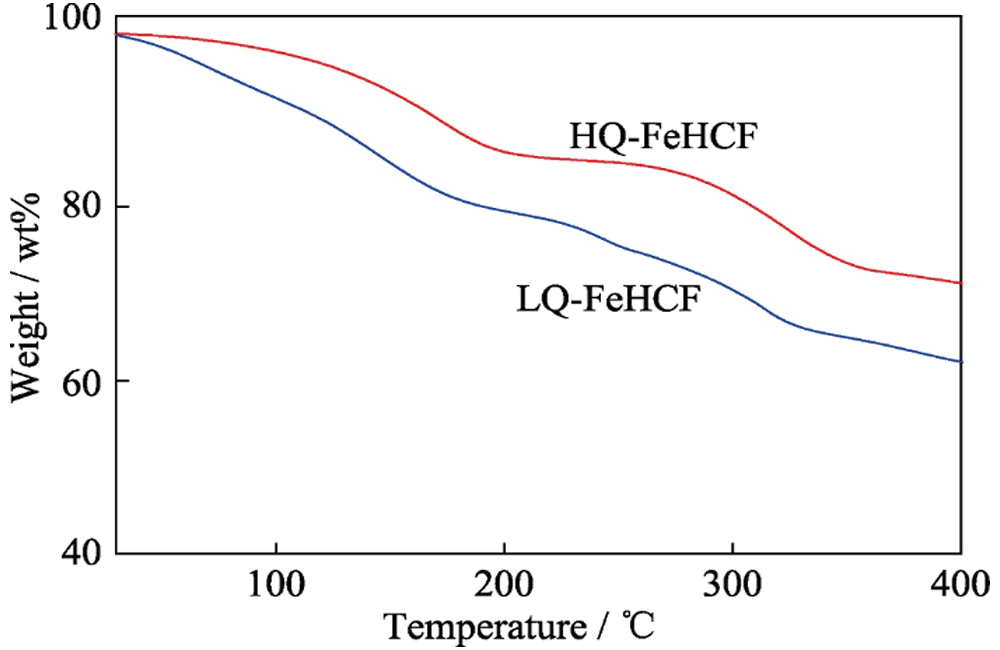
Fig. 6 TG curves of HQ-FeHCF and LQ-FeHCF after 500 cycles
The phase transition mechanism of the HQ-FeHCF material during the electrochemical reaction was studied by ex-situ XRD technique. Figure 7 shows the XRD patterns of the material under different charging and discharging states, a~e are the charging process, f~i are the discharging process, and the dots are marked with Ti diffraction peaks. Taking the group of diffraction peaks in the dotted line box as an example, it can be clearly seen from the figure that the XRD diffraction peaks shift to the direction of increasing 2θ during the process of a~e, from 24.3° to 24.6°. This is due to the lattice contraction caused by Na+ extraction from HQ-FeHCF during the charging process. The volume change of the unit cell during this process is about 8.1%. During f~i process, the XRD diffraction peak shifts to the direction of 2θ decrease, and returns to 24.3° again. This is because Na+ reintercalates into HQ-FeHCF during the discharge process, causing lattice expansion. It is worth noting that the positions of a and i diffraction peaks are highly coincident. This indicates that the deintercalation of Na+ in HQ-FeHCF material is highly reversible, and the reversible deintercalation of Na+ will not destroy the crystal structure of the material. It also shows that HQ-FeHCF has high stability in Na-H2O-PEG electrolyte.
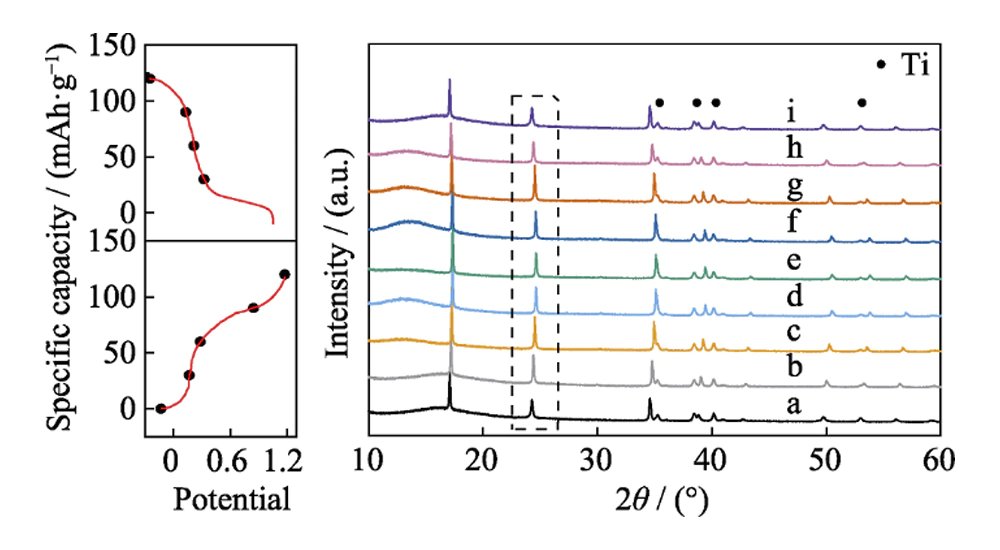
Fig. 7 Ex situ XRD patterns of HQ-FeHCF material at various states of charge and discharge
NASICON-type NaTi2(PO4)3 has an open three-dimensional structure suitable for the diffusion of sodium ions. Therefore, NaTi2(PO4)3 can be used not only as an electrode material for organic sodium-ion batteries, but also as an electrode material for aqueous sodium-ion batteries. NaTi2(PO4)3 was prepared by a previous method, and its electrochemical properties in Na-H2O-PEG electrolyte were studied by cyclic voltammetry (CV) and galvanostatic charge-discharge. Figure 8(a) shows the CV curve of NaTi2(PO4)3 at a scan rate of 1 mV s-1, with a pair of sharp redox peaks at -0.64 and -0.79 V (vs. Ag / AgCl). This corresponds to the intercalation/extraction of Na+, accompanied by the reversible conversion between Ti3+ and Ti4+. The voltage distribution of NaTi2(PO4)3 is shown in Figure 8(b). The flat discharge platform at -0.69 V (vs. Ag/AgCl) indicates that NaTi2(PO4)3 is a good anode material for aqueous sodium-ion batteries.
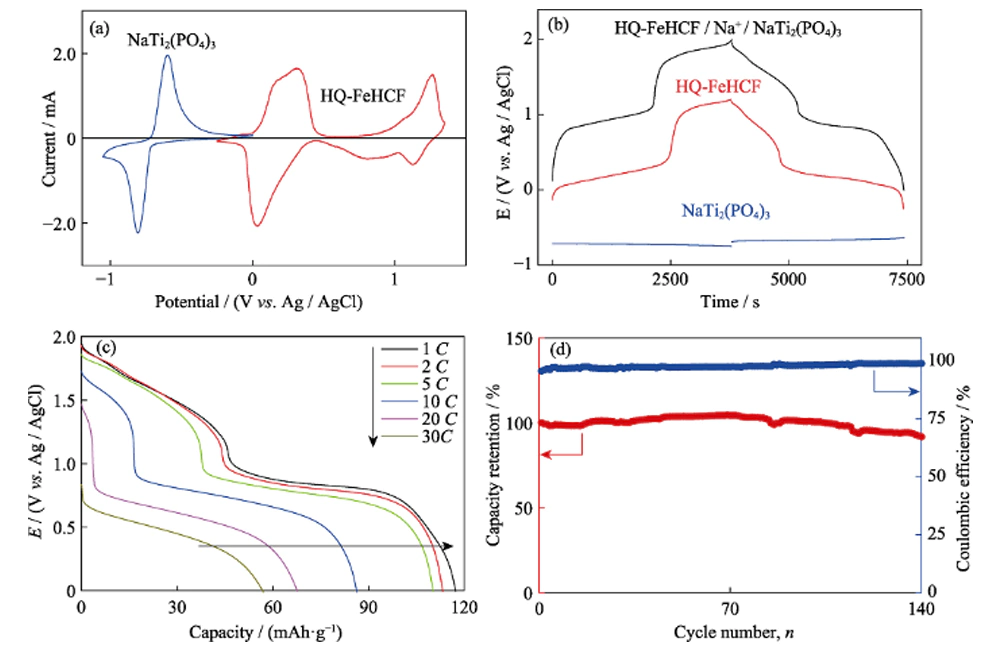
Fig. 8 (a) Cyclic voltammogram (CV) curves of HQ-FeHCF and NaTi2(PO4) at the sweep rate of 1 mV·s-1 in the electrolyte of Na-H2O-PEG; (b) Galvanostatic charge-discharge profiles at 1C for full cell, cathode, and anodein the electrolyte of Na-H2O-PEG; (c) Rate performance and (d) cycling performance of full cell
Good electrochemical performance based on HQ-FeHCF and NaTi2(PO4)3. We assembled an aqueous sodium-ion full battery with HQ-FeHCF as the positive electrode, NaTi2(PO4)3 as the negative electrode, and NaClO4-H2O-PEG as the electrolyte. Figure 8(b) shows the voltage curves of the positive electrode, the negative electrode, and the full battery at a rate of 1C. It can be seen from the figure that the working voltage of the full battery is as high as 1.9 V. A high working voltage is conducive to improving the energy density of the full battery, and the energy density of the full battery calculated based on the mass of the active material is as high as 126 Wh kg-1. It exceeds the energy density of most previously reported aqueous Na-ion full cells using manganese oxide, phosphate, and Prussian blue as cathode materials. The specific comparison is shown in Table 3. As shown in Fig. 8(c), at the rate of 1C, 2C, 5C, 10C, 20C and 30C, the capacities of the full battery are 117, 113, 110, 86, 68 and 57 mAh·g-1, respectively, which shows that excellent rate performance. Figure 8(d) shows the cycle performance of the full battery at 5C rate. In the first 70 cycles, the capacity of the full battery increases slightly, and the Coulombic efficiency gradually increases from 96% in the first cycle to a level close to 100%. In the following 70 cycles, the capacity began to decline slowly, until the 140th cycle, the capacity retention rate of the full battery was 92%, and the Coulombic efficiency remained close to 100%. Although the cut-off charging voltage of the full battery is as high as 2 V, far exceeding the theoretical decomposition voltage of water (1.23 V), it can still maintain high Coulombic efficiency, showing the advantages of Na-H2O-PEG electrolyte in aqueous Na-ion batteries.
Table 3 Energy density of different aqueous sodium-ion batteries
|
Cathode |
Anode |
Energy density/(Wh·kg-1) |
Ref. |
|
Na0.44MnO2 |
NaTi2(PO4)3 |
33 |
[39] |
|
Na2Ni[Fe(CN)6] |
NaTi2(PO4)3 |
43 |
[13] |
|
Na2Cu[Fe(CN)6] |
NaTi2(PO4)3 |
48 |
[40] |
|
NaMnO2 |
NaTi2(PO4)3 |
30 |
[12] |
|
K0.27MnO2 |
NaTi2(PO4)3 |
55 |
[41] |
|
NaFePO4 |
NaTi2(PO4)3 |
61 |
[42] |
|
Na2VTi(PO4)3 |
NaTi2(PO4)3 |
68 |
[43] |
|
Na3MnTi(PO4)3 |
NaTi2(PO4)3 |
82 |
[44] |
|
Na0.66Mn0.66Ti0.34O2 |
NaTi2(PO4)3 |
76 |
[45] |
|
Na2Ni0.4Co0.6[Fe(CN)6] |
NaTi2(PO4)3 |
121 |
[46] |
|
Fe4[Fe(CN)6]3 |
NaTi2(PO4)3 |
126 |
This work |
Conclusion
In this study, high-quality and low-defect Fe4[Fe(CN)6]3 nanomaterials were successfully synthesized by a simple and convenient hydrothermal method. The XRD test results show that the material is a face-centered cubic (fcc) structure, which belongs to the Fm-3m space point group. SEM and TEM test results show that the synthesized Fe4[Fe(CN)6]3 has excellent crystallinity, and the material has a typical cubic structure with a side length of about 500 nm. The surface of the material is smooth and uniform without serious accumulation. Compared with the low-quality Fe4[Fe(CN)6]3 synthesized by traditional methods. The Fe4[Fe(CN)6]3 synthesized in this paper can effectively reduce the vacancy defects and regulate the crystal water in the material, so that the material has excellent electrochemical performance: The specific capacity at 1C rate is as high as 124 mAh·g-1, and the specific capacity at 2C, 5C, 10C, 20C, 30C and 40C rate is 124, 118, 105, 94, 83, 74 and 64 mAh·g-1, respectively, showing excellent rate performance. After 500 cycles at 5C rate, the capacity retention rate is close to 100%, showing excellent cycle stability. The working voltage of the full battery with Fe4[Fe(CN)6]3 and sodium titanium phosphate as the positive and negative electrodes is as high as 1.9 V, and the energy density can reach 126 Wh kg-1. After 140 times of constant current charging and discharging at 5C rate, the full battery capacity retention rate is 92%, and the Coulombic efficiency is close to 100%. The Fe4[Fe(CN)6]3 synthesized by this environmentally friendly and convenient method is expected to be used as the cathode material for aqueous Na-ion batteries.
Learn more about sodium ion battery materials from TOB NEW ENERGY.