

Categories
new blog
- A Technical Roadmap from Battery Lab Line and Pilot Line to Full-Scale Battery Production Line Solutions
- TOB NEW ENERGY: China Integrated Battery Solutions Supplier Equipment and Materials to Turnkey Production Lines
- TOB Senior Engineer Appointed CSU Industry Graduate Mentor
- Solid-State Battery Manufacturing Equipment Guide 2026–2027
- Supercapacitors vs Batteries: Complementary Industrial Energy Storage
Tags
Na3Zr2Si2PO12 Ceramic Electrolytes for Na-ion Battery
Na3Zr2Si2PO12 Ceramic Electrolytes for Na-ion Battery: Preparation Using Spray-drying Method and Its Property
Author:LI Wenkai, ZHAO Ning, BI Zhijie, GUO Xiangxin. Na3Zr2Si2PO12 Ceramic Electrolytes for Na-ion Battery: Preparation Using Spray-drying Method and Its Property. Journal of Inorganic Materials, 2022, 37(2): 189-196 DOI:10.15541/jim20210486
Abstract
Na-ion batteries, which currently use flammable and explosive organic electrolytes, now urgently need to develop high performance sodium ion solid electrolyte to realize more safe and practical application. Na3Zr2Si2PO12 is one of the most promising solid sodium electrolytes for its wide electrochemical window, high mechanical strength, superior air stability and high ionic conductivity. But its inhomogeneous mixing of the ceramic particles with the binders causing much more pores in the green bodies makes it difficult to obtain high-density and high-conductivity ceramic electrolytes after sintering. Herein, the spray drying method was used to enable Na3Zr2Si2PO12 particles uniformly coated with binders and granulated into spherical secondary ones. The as-prepared normal distributed particles can effectively contact each other and reduce porosity of ceramic green body. After sintering, Na3Zr2Si2PO12 ceramic pellets via the spray drying show relative density of 97.5% and ionic conductivity of 6.96×10⁻⁴ S∙cm-1 at room temperature. In contrast, the relative density and room-temperature ionic-conductivity of Na3Zr2Si2PO12 ceramic pellets prepared without the spray-drying are only 88.1% and 4.94×10⁻⁴ S∙cm-1, respectively.
Keywords: solid electrolyte; spray-drying method; density; ionic conductivity; Na3Zr2Si2PO12
Sodium ions and lithium ions both belong to the first main group, have similar chemical properties and intercalation mechanisms, and are rich in resource reserves. Therefore, sodium ion batteries can complement lithium ion batteries [1, 2, 3]. Sodium-ion batteries containing flammable, volatile organic electrolytes present safety concerns and limited energy density. If solid electrolytes are used instead of liquid electrolytes, safety issues are expected to be solved [4,5,6,7,8]. Inorganic solid electrolytes have a wide electrochemical window and can be matched with high-voltage cathode materials, thereby increasing the energy density of batteries [9]. However, solid electrolytes face challenges such as low ionic conductivity and difficult ion transmission at the interface between electrodes and electrolytes. While optimizing the interface, it is first necessary to find solid electrolytes with high ionic conductivity [10, 11, 12].
At present, the most studied sodium ion inorganic solid electrolytes mainly include Na-β”-Al2O3, NASICON type and sulfide. Among them, NASICON (Sodium Super Ion Conductors) type fast ion conductors have great potential in solid-state sodium-ion battery applications due to their wide electrochemical window, high mechanical strength, stability to air, and high ion conductivity [13,14] . It was originally reported by Goodenough and Hong et al. [15,16]. The general formula is Na1+xZr2SixP3-xO12 (0≤x≤3), which is a continuous solid solution formed by NaZr2(PO4)3 and Na4Zr2(SiO4)3 and has an open three-dimensional Na+ transmission channel. Na1+xZr2SixP3-xO12 has two structures: rhombus structure (R-3c) and monoclinic structure (C2/c, 1.8≤x≤2.2). When x=2, Na3Zr2Si2PO12 has the highest ionic conductivity. At 300 ℃, the ionic conductivity of Na3Zr2Si2PO12 can reach 0.2 S∙cm-1, which is close to the ionic conductivity of Na-β”-Al2O3 (0.1~ 0.3 S∙cm-1) [15]. The current room temperature ion conductivity of Na3Zr2Si2PO12 reported in the literature [17,18] is approximately ~10-4 S∙cm-1. Element doping methods are commonly used to improve ion conductivity. Since the NASICON solid electrolyte has an open skeleton structure, it can be doped with a variety of elements. For example, elements that replace Zr4+ include Mg2+, Zn2+, Al3+, Sc3+, Y3+, La3+, Ti4+, Hf 4+, Nb5+, Ta5+, etc. [17, 18, 19, 20, 21, 22]. Those replacing P5+ include Ge5+ and As5+ [22]. In addition to element doping, increasing the density of Na3Zr2Si2PO12 ceramic sheets is also a common method to improve their ionic conductivity. Recently, Yang et al. [18] used element doping combined with sintering in an oxygen atmosphere to synthesize highly dense Na3.2+2xZr2-x ZnxSi2.2P0.8O12 (0≤x≤0.15). When x=0.1, the room temperature ionic conductivity reaches the maximum value (5.27×10⁻³ S∙cm-1). The preparation methods of Na3Zr2Si2PO12 ceramic electrolyte include: conventional sintering (CS), liquid phase sintering (LPS), spark plasma sintering (SPS), microwave sintering (MWS), and cold sintering process (CSP) [18-21,23-29]. Among them, Huang et al. [20] used conventional sintering methods to increase the density of ceramics by doping Ga3+. A ceramic electrolyte with higher room temperature ionic conductivity (1.06×10⁻³ S∙cm-1) and lower electronic conductivity (6.17×10⁻⁸ S∙cm-1) was obtained. ZHANG et al. [21] adopted conventional sintering method by introducing cation La3+. The intermediate phase Na3La(PO4)2 is formed at the grain boundary, and a Na3.3Zr1.7La0.3Si2PO12 ceramic sheet with a density as high as 99.6% is obtained. The corresponding room temperature ion conductivity can reach 3.4×10⁻³ S∙cm-1. WANG et al. [23] used microwave sintering (MWS) to obtain Na3Zr2Si2PO12 ceramics with a high density of 96% at a low sintering temperature of 850°C and only held for 0.5 h, reducing sintering costs. The values of relative density (rrelative), ionic conductivity (σt) and activation energy (Ea) of ceramic electrolytes prepared by different methods are listed in Table 1.
Table 1 Key parameters of NASICON-type materials for different sintering method
|
Sintering method |
Composition |
Sintering |
Sintering |
Time/h |
rrelative/% |
st/(S∙cm-1) |
Ea/eV |
Ref. |
|
CSP |
Na3.256Mg0.128Zr1.872Si2PO12 |
140 |
None |
1 |
82.9 |
0.41´10-4 |
- |
[19] |
|
FH-CSP |
Na3Zr2Si2PO12 |
375 |
NaOH |
3 |
93 |
2.2´10-4 |
0.32 |
[24] |
|
LPS |
Na3Zr2Si2PO12 |
1150 |
NaF |
24 |
- |
1.7´10-3 |
0.28 |
[25] |
|
LPS |
Na3Zr2Si2PO12 |
900 |
Na3BO3 |
10 |
93 |
1.4´10-3 |
- |
[26] |
|
LPS |
Na3Zr2Si2PO12 |
1175 |
Na3SiO3 |
10 |
93 |
1.45´10-3 |
- |
[27] |
|
SPS |
Na3.4Zr1.6Sc0.4Si2PO12 |
1100 |
KOHaq |
0.1 |
95 |
9.3´10-4 |
- |
[28] |
|
SPS |
Na3Zr2Si2PO12 |
1210 |
None |
0.5 |
97.0 |
1.7´10-3 |
0.28 |
[29] |
|
MWS |
Na3Zr2Si2PO12 |
850 |
None |
0.5 |
96 |
2.5´10-4 |
0.31 |
[23] |
|
CS |
Na3Zr2Si2PO12 |
1250 |
None |
16 |
71.4 |
1.7´10-4 |
0.36 |
[20] |
|
CS |
Na3.1Zr1.9Ga0.1Si2PO12 |
1250 |
None |
16 |
86.5 |
1.06´10-3 |
0.29 |
[20] |
|
CS |
Na3Zr2Si2PO12 |
1200 |
None |
24 |
87.6 |
6.7´10-4 |
0.353 |
[21] |
|
CS |
Na3.3Zr1.7La0.3Si2PO12 |
1200 |
None |
24 |
99.6 |
3.4´10-3 |
0.291 |
[21] |
|
CS |
Na3Zr2Si2PO12 |
1250 |
None |
- |
84.02 |
2.17´10-4 |
0.407 |
[18] |
|
O2-CS |
Na3.4Zr1.9Zn0.1Si2.2P0.8O12 |
1250 |
None |
- |
99.46 |
5.27´10-3 |
0.285 |
[18] |
|
CS |
Na3Zr2Si2PO12 |
1250 |
None |
6 |
88.1 |
4.94´10-4 |
0.34 |
This work |
|
SD-CS |
Na3Zr2Si2PO12 |
1250 |
None |
6 |
97.5 |
6.96´10-4 |
0.32 |
This work |
CS: conventional sintering; SD: spray drying; O2-CS: conventional sintering in pure oxygen; CSP: cold sintering process; FH-CSP: fused hydroxide cold sintering process; MWS: microwave sintering; LPS: liquid-phase sintering; SPS: spark plasma sintering
Conventional methods use powder prepared by direct sintering to mix with a binder to produce ceramic body powder, and then undergo powder molding and high-temperature sintering to obtain ceramics [30, 31, 32]. However, during the grinding and mixing process, due to uneven mixing of the binder and ceramic particles and poor contact between particles, there are many pores inside the green body, making it difficult to prepare ceramic electrolytes with high density and high ionic conductivity. Spray drying is a rapid drying method that uses an atomizer to disperse the slurry into droplets and uses hot air to dry the droplets to obtain powder. The particles of the powder prepared by spray drying are spherical, and the binder can be evenly coated on the surface of the particles [33]. KOU et al. [34] used spray drying combined with high-temperature sintering to synthesize solid electrolyte Li1.3Al0.3Ti1.7SixP5(3-0.8x)O12 (LATSP) with high room temperature ionic conductivity. When x=0.05, the room temperature ionic conductivity reaches a maximum of 1.053×10⁻⁴ S∙cm-1, and the compacted density is 2.892 g∙cm-3, which is close to the theoretical density of LATSP of 2.94 g∙cm-3. It can be seen that spray drying has certain advantages in improving the density and ionic conductivity of ceramic electrolytes. In view of the advantages of spray drying, the effect of element doping on ceramic density and ionic conductivity should be considered. This study selected Na3Zr2Si2PO12 as the research object and introduced the spray granulation method into the preliminary preparation of powder materials to prepare Na3Zr2Si2PO12 ceramic electrolyte with high density and high ionic conductivity.
1 Experimental method
1.1 Material preparation
Preparation method of Na3Zr2Si2PO12 powder: Weigh Na2CO3 (Aladdin, 99.99%), NH4H2PO4 (Aladdin, 99%), ZrO2 (Aladdin, 99.99%), and SiO2 (Aladdin, 99.99%) according to the stoichiometric ratio. In order to compensate for the volatilization of Na and P during the sintering process, the raw material contains an excess of 8% Na2CO3 and 15% excess of NH4H2PO4 [25]. Zirconia balls were used as the ball milling medium, the material/ball weight ratio was 1:3, absolute ethanol was used as the dispersion medium, and the ball mill was used for ball milling for 12 h. The ball-milled slurry was dried in an oven at 80 °C for 12 h. The dried powder was ground and passed through a 150 mesh (100 μm) sieve, and then transferred to a 400°C alumina crucible for 2 h. Remove CO32- and NH4+ from the precursor, then heat it up to 1000~1150°C for calcination, and anneal it after 12 hours to obtain Na3Zr2Si2PO12 powder.
Preparation method of Na3Zr2Si2PO12 ceramic sheets: In order to explore the effect of Na3Zr2Si2PO12 particle size on the density of ceramic sheets, two sets of control experiments were designed. The first group used conventional methods, adding 2% (mass fraction) polyvinyl alcohol (Aladdin, Mw~205000) binder to pure phase Na3Zr2Si2PO12 powder, adding absolute ethanol, and ball milling for 12 h. The powder after ball milling is dried, grinded and sieved to obtain a powder coated with a binder on the particle surface. The powder is uniaxially cold pressed at 200 MPa using a stainless steel mold to make a green body of φ12 mm, recorded as GB. . In order to reduce the volatilization of Na and P during the sintering process of ceramic sheets, the green body was buried in the mother powder and sintered at 1250°C for 6 hours and then annealed at a heating rate of 4°C/min. The obtained Na3Zr2Si2PO12 ceramic electrolyte was designated as CS-NZSP. The second group used a spray dryer (ADL311S, Yamato, Japan) to granulate Na3Zr2Si2PO12 powder. Add 2% (mass fraction) polyvinyl alcohol (Aladdin, Mw ~205000) binder and 2% polyethylene glycol (Aladdin, Mn=1000) dispersant to the Na3Zr2Si2PO12 powder, and add absolute ethanol. Prepare a suspension with a solid content of 15% mass fraction and ball-mill for 12 h. The ball-milled suspension was spray-dried with an inlet temperature of 130°C and a feed flow rate of 5 mL/min. The Na3Zr2Si2PO12 powder was collected through a cyclone separator. The tableting and ceramic sintering processes were the same as those of the first group, and the obtained Na3Zr2Si2PO12 green body and ceramic electrolyte were recorded as SD-GB and SD-CS-NZSP respectively. Surface polishing treatment of ceramic tiles: First use 400 mesh (38 μm) sanding paper for rough polishing, and then use 1200 mesh (2.1 μm) sanding paper for fine polishing until the ceramic surface is smooth. The diameters of CS-NZSP and SD-CS-NZSP ceramic electrolyte sheets are (11.3±0.1) and (10.3±0.1) mm respectively, and the thickness is (1.0±0.1) mm.
1.2 Physical characterization of materials
The phase analysis of the samples was performed using an X-ray diffractometer (XRD, Bruker, D8 Advance). The radiation source is CuKα, the tube pressure is 40 kV, the tube flow is 40 mA, the scanning rate is 2 (°)/min, and the scanning range is 2θ= 10°~80°. Scanning electron microscope (SEM, Hitachi, S-4800) and transmission electron microscope (TEM, JEOL, JEM-2100F) were used to analyze the morphology of the samples, and the configured EDX accessory was used for elemental analysis.
1.3 Measurement of electrical conductivity of ceramic sheets
The electrochemical impedance spectroscopy (EIS) of the sample was tested using an electrochemical workstation. The test frequency range is 7 MHz~0.1 Hz, the applied voltage is 10 mV, the test curve is fitted, and the ionic conductivity of the ceramic piece is calculated using formula (1).
σ=L/(R×S) (1)
In the formula, L is the thickness of the ceramic sheet (cm), R is the resistance (Ω), S is the blocking electrode area (cm2), and σ is the ionic conductivity (S∙cm-1).
The electronic conductivity of the sample was tested using direct current polarization (DC), with a constant voltage of 5 V and a duration of 5000 s. The ordinate value after the curve becomes stable is the polarization current value. Use formulas (2, 3) to calculate the electronic conductivity and sodium ion migration number of the ceramic sheet.
σe=L×I/(V×S) (2)
t=(σ-σe)/σ (3)
In the formula, L is the thickness of the ceramic sheet (cm), I is the polarization current (A), V is the voltage (V), S is the blocking electrode area (cm2), and σe is the electronic conductivity (S∙cm-1). This work uses Au as the blocking electrode. Preparation of blocking electrode: Use high vacuum resistance evaporation coating equipment (VZZ-300) to evaporate the evaporation source Au through resistance heating, and evaporate it onto the surface of the ceramic sheet. The ceramic sheet is fixed in a ferrule with an inner diameter of 8 mm.
2 Results and discussion
2.1 Phase structure and morphology characterization of Na3Zr2Si2PO12
In order to optimize the sintering temperature of Na3Zr2Si2PO12, the powder was sintered at 1000, 1050, 1100 and 1150 ℃ respectively. The X-ray diffraction patterns of the samples obtained under different temperature sintering are shown in Figure 1. It can be seen from the figure that when the sintering temperature is 1000 ° C, the main phase of Na3Zr2Si2PO12 has been generated, but there are Na2ZrSi2O7 and ZrO2 impurity phases, and the diffraction peak intensity of the main phase is weak and the half-peak width is wide, indicating that the sintering product has poor crystallinity. When the sintering temperature is 1100 ℃, the ZrO2 impurity phase disappears and the diffraction peak intensity of the Na2ZrSi2O7 impurity phase weakens, indicating that increasing the sintering temperature is beneficial to eliminating the impurity phase. The diffraction peaks of the products sintered at 1100 and 1150 °C have smaller half-peak widths than the diffraction peaks of the products sintered at 1000 °C, indicating that the higher the sintering temperature, the better the crystallinity of the product. Compared with the 1000 ℃ sintered product, the diffraction peaks of the 1150 ℃ sintered product are split at 2θ = 19.2°, 27.5° and 30.5°. This shows that the material changes from a rhombic phase with low ionic conductivity to a monoclinic phase with high ionic conductivity [25,35]. And the diffraction peak is consistent with the standard PDF 84-1200 diffraction peak, indicating that 1150°C is the phase formation temperature of Na3Zr2Si2PO12 solid electrolyte with a high ion conductivity monoclinic structure.
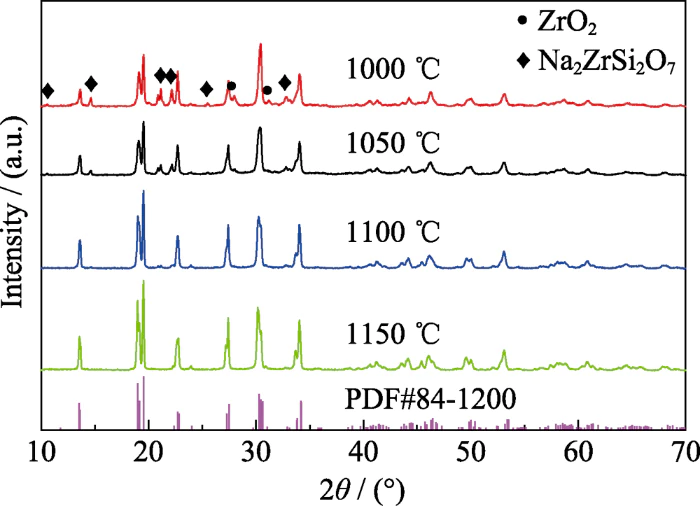
Fig. 1 XRD patterns of Na3Zr2Si2PO12 powder sintered at different temperatures
Figure 2 shows SEM photos and TEM photos of Na3Zr2Si2PO12 particles obtained by conventional mixing and spray drying methods. Figure 2(a) is an SEM photo of Na3Zr2Si2PO12 particles after conventional mixing. It can be seen from the picture that the shape of the particles is irregular, and the diameter of some particles reaches 20 μm, indicating that the particles after conventional mixing are large in size and uneven in shape. Figure 2(b~c) shows SEM photos of Na3Zr2Si2PO12 particles after spray drying. The particles are spherical and the particle diameter is less than 5 μm, indicating that the particle shape is regular and the particle size distribution is more concentrated after spray drying. Figure 2(d) is a TEM photo of the surface of Na3Zr2Si2PO12 particles after spray drying. The particle surface is evenly coated with a layer of binder with a thickness of about 5 nm, which is conducive to closer contact between ceramic particles.
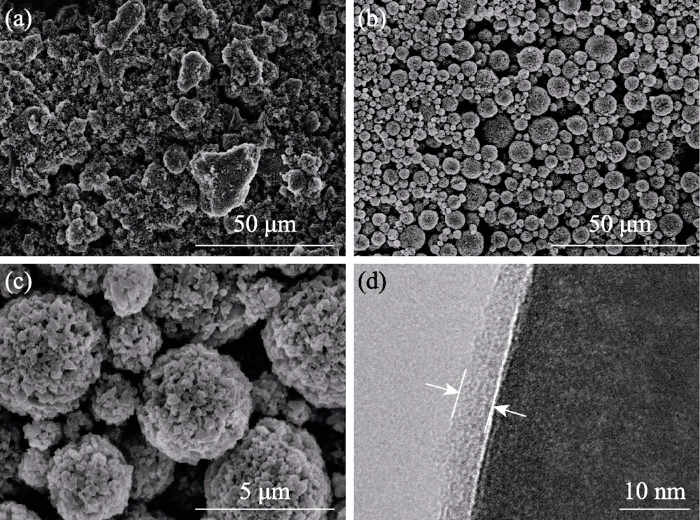
Fig. 2 SEM images of Na3Zr2Si2PO12 particle after conventional mixing (a) and spray drying (b-c), and TEM image (d) of Na3Zr2Si2PO12 particle surface after spray drying
Figure 3 shows the particle size distribution diagram of the polyvinyl alcohol-coated Na3Zr2Si2PO12 (NZSP) obtained by conventional mixing and the polyvinyl alcohol-coated Na3Zr2Si2PO12 (SD-NZSP) obtained by the spray drying method. It can be seen that the half-peak width of the SD-NZSP particle size distribution curve is narrower than that of the NZSP particle size curve, indicating that the particle size distribution after spray drying is more concentrated. This is basically consistent with the results shown in the SEM photos in Figure 2(a,b). In addition, the particle size distribution curve after spray drying is close to a normal distribution. This particle size gradation can effectively increase the contact between particles and reduce the porosity of the green body. As shown in Table 2, the density of the Na3Zr2Si2PO12 green body prepared by the conventional mixing method is 83.01%, and the density of the Na3Zr2Si2PO12 green body prepared by the spray drying method is increased to 89.12%. In order to further explore the effect of Na3Zr2Si2PO12 particle size on ceramic density and conductivity, cross-sectional scanning, density measurement and conductivity test were conducted on Na3Zr2Si2PO12 ceramic sheets obtained by conventional mixing and spray drying methods.
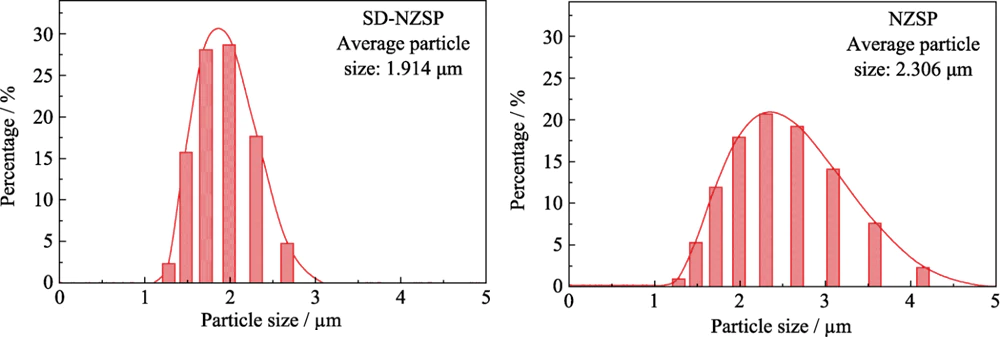
Fig. 3 Na3Zr2Si2PO12 particle size profiles of conventional mixing (NZSP) and spraying drying (SD-NZSP) measured by laser particle analyzer
Table 2 Sintering parameters and density measurement parameters and measurement results of Na3Zr2Si2PO12 solid electrolyte green bodies and ceramic sheet
|
Sample |
Process temp./℃ |
Time/h |
m/g |
rethanol/(g·cm-3) |
msubmerged/g |
rreal/(g·cm-3) |
rtheoretical/(g·cm-3) |
rrelative/% |
|
GB |
- |
- |
0.2902 |
0.785 |
0.2056 |
2.693 |
3.244 |
83.01 |
|
SD-GB |
- |
- |
0.2880 |
0.785 |
0.2098 |
2.891 |
3.244 |
89.12 |
|
CS-NZSP |
1250 |
6 |
0.2672 |
0.785 |
0.1938 |
2.858 |
3.244 |
88.10 |
|
SD-CS-NZSP |
1250 |
6 |
0.2644 |
0.785 |
0.1988 |
3.164 |
3.244 |
97.53 |
Figure 4 shows the physical picture of the Na3Zr2Si2PO12 ceramic sheet, its cross-sectional morphology and elemental analysis diagram. Figure 4(a) shows the cross-sectional morphology of the ceramic piece obtained by the conventional sintering method. It was observed that there were many irregular pores in the cross section of the ceramic sheet, and the local pore diameter exceeded 5 μm. The reason is that the particle size after grinding is uneven, there are larger particles, and there is no close contact between the particles, resulting in more irregular pores in the ceramic sheet during the secondary sintering process. Figure 4(b) shows the cross-sectional morphology of the ceramic piece obtained by the spray drying method. The crystal grains are in close contact with each other and there are no obvious pores. This shows that Na3Zr2Si2PO12 particles with regular shape and concentrated particle size distribution can easily obtain high-density ceramic sheets during the secondary sintering process. The increase in density is also reflected in the increase in shrinkage of the ceramic body after sintering, as shown in Figure 4(c). On the left is a ceramic piece obtained by the conventional sintering method, with a diameter of 11.34 mm, and a shrinkage rate of only 5.5%; on the right is a ceramic piece obtained by the spray drying method, with a diameter of 10.36 mm, and a shrinkage rate of 13.7%. In order to explore the composition of each element in the sample, elemental analysis was performed on the cross section of the ceramic piece (Figure 4(b)), and Figure 4(d~g) was obtained. The content of each element is shown in Table 3. Each element is evenly distributed on the cross section of the ceramic piece, and there is no aggregation of elements. According to Table 3, it is found that the atomic percentage of Na and P is 2.98:1, which is basically consistent with the standard chemical formula of Na:P=3:1, indicating that excess Na and P in the raw materials can compensate for the volatilization of Na and P during the sintering process.
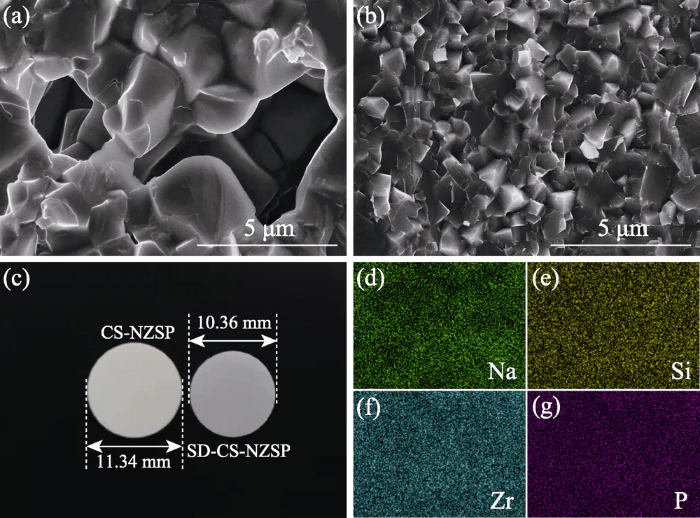
Fig. 4 SEM images of slice sections for CS-NZSP (a) and SD-CS-NZSP (b), corresponding photographs (c) and elemental mapping images (d-g) of SD-CS-NZSP
Table 3 Elemental analysis of Na3Zr2Si2PO12 ceramic slice section by spray drying/%
|
Element |
O K |
Na K |
Si K |
P K |
Zr L |
|
Atomic percentage |
60.10 |
15.09 |
9.94 |
5.06 |
9.81 |
|
Weight percentage |
36.43 |
13.13 |
10.59 |
5.94 |
33.91 |
2.2 Density of Na3Zr2Si2PO12 ceramic sheets
The experiment measured the density of Na3Zr2Si2PO12 ceramic sheets through Archimedes' method [30]. In order to study the effect of granulation method on the density of Na3Zr2Si2PO12 ceramic sheets, in the experimental parameters of ceramic sheet preparation, the experimental parameters (sintering temperature, holding time, etc.) of the control experimental group except the granulation method were kept the same. In order to reduce the impact of experimental measurement errors on the density results, the density measurements were repeated on the ceramic sheet samples obtained by each preparation method in the experiment. From the experimental data shown in Table 4, it can be seen that the density of CS-NZSP ceramic sheets obtained by conventional sintering method is 88.1%, which is basically consistent with the results reported in the literature [21]. The density of SD-CS-NZSP ceramic sheets obtained by spray drying can reach 97.5%, which is the highest value currently achieved by conventional sintering methods without element doping. It is even higher than the density of Na3Zr2Si2PO12 ceramic sheets obtained by other sintering methods reported in the literature. Such as microwave sintering method (96%) [23], cold sintering method (93%) [24], liquid phase sintering method (93%) [26] and discharge plasma sintering method (97.0%) [29].
Table 4 Ionic conductivity of CS-NZSP and SD-CS-NZSP at room temperature
|
Sample |
sb/(S·cm-1) |
sgb/(S·cm-1) |
st/(S·cm-1) |
Ea/eV |
|
CS-NZSP |
1.28×10⁻³ |
8.03×10⁻⁴ |
4.94×10⁻⁴ |
0.34 |
|
SD-CS-NZSP |
1.64×10⁻³ |
1.21×10⁻³ |
6.96×10⁻⁴ |
0.32 |
2.3 Na3Zr2Si2PO12 electrical performance test
Figure 5(a) shows the room temperature electrochemical impedance spectrum (EIS) of the ceramic wafer obtained by conventional sintering method and spray drying method. The semicircle in the figure reflects the parallel impedance characteristics of grain boundary impedance and capacitive reactance. The intersection between the left side of the semicircle and the abscissa represents the resistance of the grain. The span of the semicircle on the abscissa reflects the resistance of the grain boundary, and the oblique line after the semicircle reflects the impedance characteristics of the blocking electrode/electrolyte interface [36]. By fitting the EIS in Figure 4, the ionic conductivity of CS-NZSP and SD-CS-NZSP can be obtained. The experimental data are shown in Table 4. The room temperature ionic conductivity of SD-CS-NZSP obtained by the spray drying method is 6.96×10⁻⁴ S∙cm-1, which is higher than that of CS-NZSP (4.94×10⁻⁴ S∙cm-1) obtained by the conventional sintering method. Through the data analysis of EIS fitting, it can be seen that SD-CS-NZSP with higher density has smaller grain boundary resistance and higher room temperature ionic conductivity.
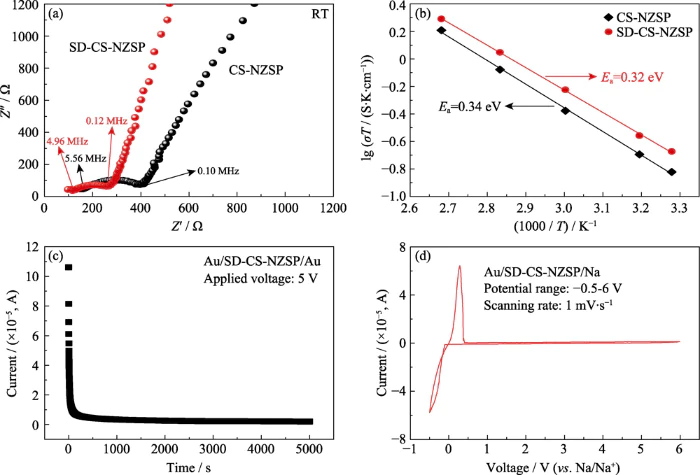
Fig. 5 (a) EIS spectra at room temperature and (b) Arrhenius plots of CS-NZSP and SD-CS-NZSP; (c) DC potentiostatic polarization current and (d) electrochemical window for SD-CS-NZSP
Figure 5(b) shows the Arrhenius curves from room temperature to 100°C for ceramic sheets obtained by different preparation methods. It can be seen from the figure that their conductivities increase with increasing temperature. When the temperature reaches 100 °C, the conductivity of SD-CS-NZSP can reach 5.24×10⁻³ S∙cm-1, which is an order of magnitude higher than the room temperature conductivity. Its activation energy is fitted according to the Arrhenius equationσ=Aexp(-Ea/kT)[7]. The activation energies of CS-NZSP and SD-CS-NZSP were obtained to be 0.34 and 0.32 eV respectively, which are similar to the report of YANG et al. [18].
Solid electrolyte materials should have both high ionic conductivity and low electronic conductivity. Therefore, the electronic conductivity of SD-CS-NZSP was measured by direct current polarization (DC), and the corresponding polarization curve is shown in Figure 5(c). It can be seen from the figure that as the test time prolongs, the polarization current gradually decreases; when the test time reaches 5000 s, the polarization current (I=3.1 μA) no longer changes as the test time prolongs. Calculated through formulas (2, 3), the electronic conductivity of SD-CS-NZSP is 1.23×10⁻⁷ S∙cm-1, and the sodium ion migration number is 0.9998. The study also measured the electrochemical window of SD-CS-NZSP by cyclic voltammetry (CV) [18]. As shown in Figure 5(d), two oxidation and reduction peaks appear at around 0 V, representing the stripping and deposition of sodium respectively [20]. Apart from this, no other redox peaks were observed within the scanned voltage range. This means that there is no change in current due to the decomposition of the electrolyte in the voltage range of 0~6 V, indicating that SD-CS-NZSP has good electrochemical stability. The wide electrochemical window (6 V (vs. Na/Na+)) can match the sodium-ion solid electrolyte to high-voltage cathode materials, such as nickel-manganese-based cathode materials, which is beneficial to improving the energy density of sodium-ion batteries.
3 Conclusion
A high-temperature solid-phase method was used to synthesize pure-phase Na3Zr2Si2PO12 powder at a sintering temperature of 1150°C by introducing excess Na and P into the precursor. Using spray drying to spherically granulate the powder, the polyvinyl alcohol binder is uniformly coated on the surface of Na3Zr2Si2PO12 particles and the particle size distribution is close to normal distribution. The density of the prepared Na3Zr2Si2PO12 ceramic reaches 97.5%. Increased density can effectively reduce grain boundary resistance, and the ionic conductivity reaches 6.96×10⁻⁴ S∙cm-1 at room temperature, which is higher than ceramic sheets prepared by conventional sintering methods (4.94×10⁻⁴ S∙cm-1). In addition, the ceramics produced by the spray drying method have a wide electrochemical window (6 V (vs. Na/Na+)) and can be matched with high-voltage cathode materials to increase the energy density of the battery. It can be seen that the spray drying method is an effective method to prepare Na3Zr2Si2PO12 ceramic electrolytes with high density and high ionic conductivity, and is suitable for other types of ceramic solid electrolytes.
References
[1] JIAN Z L, ZHAO L, PAN H L, et al. Carbon coated Na3V2(PO4)3 as novel electrode material for sodium-ion batteries. Electrochemistry Communications, 2012,14(1):86-89.
[2] ZHAO L, ZHAO J M, HU Y S, et al. Disodium terephthalate (Na2C8H4O4) as high performance anode material for low-cost room-temperature sodium-ion battery. Advanced Energy Materials, 2012,2(8):962-965.
[3] RUAN Y L, GUO F, LIU J J, et al. Optimization of Na3Zr2Si2PO12 ceramic electrolyte and interface for high performance solid-state sodium battery. Ceramics International, 2019,45(2):1770-1776.
[4] VETTER J, NOVAK P, WAGNER M R, et al. Ageing mechanisms in lithium-ion batteries. Journal of Power Sources, 2005,147(1/2):269-281.
[5] KAMAYA N, HOMMA K, YAMAKAWA Y, et al. A lithium superionic conductor. Nature Materials, 2011,10(9):682-686.
[6] TARASCON J M, ARMAND M. Issues and challenges facing rechargeable lithium batteries. Nature, 2001,414(6861):359-367.
[7] KHOKHAR W A, ZHAO N, HUANG W L, et al. Different behaviors of metal penetration in Na and Li solid electrolytes. ACS Applied Materials & Interfaces, 12(48):53781-53787.
[8] OUDENHOVEN J F M, BAGGETTO L, NOTTEN P H L. All- solid-state lithium-ion microbatteries: a review of various three- dimensional concepts. Advanced Energy Materials, 2011,1(1):10-33.
[9] ZHAO C L, LIU L L, QI X G, et al. Solid-state sodium batteries. Advanced Energy Materials, 2017,8(17):1703012.
[10] HAYASHI A, NOI K, SAKUDA A, et al. Superionic glass-ceramic electrolytes for room-temperature rechargeable sodium batteries. Nature Communications, 2012,3:856.
[11] LOU S F, ZHANG F, FU C K, et al. Interface issues and challenges in all-solid-state batteries: lithium, sodium, and beyond. Advanced Materials, 2020,33(6):2000721.
[12] HUANG W L, ZHAO N, BI Z J, et al. Can we find solution to eliminate Li penetration through solid garnet electrolytes? Materials Today Nano, 2020,10:100075.
[13] JIAN Z L, HU Y S, JI X L, et al. NASICON-structured materials for energy storage. Advanced Materials, 2016,29(20):1601925.
[14] HOU W R, GUO X W, SHEN X Y, et al. Solid electrolytes and interfaces in all-solid-state sodium batteries: progress and perspective. Nano Energy, 2018,52:279-291.
[15] GOODENOUGH J B, HONG H Y P, KAFALAS J A. Fast Na+-ion transport in skeleton structures. Materials Research Bulletin, 1976,11(2):203-220.
[16] HONG H Y P. Crystal structures and crystal chemistry in the system Na1+xZr2SixP3-xO12. Materials Research Bulletin, 1976,11(2):173-182.
[17] RAN L B, BAKTASH A, LI M, et al. Sc, Ge co-doping NASICON boosts solid-state sodium ion batteries’ performance. Energy Storage Materials, 2021,40:282-291.
[18] YANG J, LIU G Z, AVDEEV M, et al. Ultrastable all-solid-state sodium rechargeable batteries. ACS Energy Letters, 2020,5(9):2835-2841.
[19] LENG H Y, HUANG J J, NIE J Y, et al. Cold sintering and ionic conductivities of Na3.256Mg0.128Zr1.872Si2PO12 solid electrolytes. Journal of Power Sources, 2018,391:170-179.
[20] HUANG C C, YANG G M, YU W H, et al. Gallium-substituted Nasicon Na3Zr2Si2PO12 solid electrolytes. Journal of Alloys And Compounds, 2021,855:157501.
[21] ZHANG Z Z, ZHANG Q H, SHI J N, et al. A self-forming composite electrolyte for solid-state sodium battery with ultralong cycle life. Advanced Energy Materials, 2017,7(4):1601196.
[22] ANANTHARAMULU N, RAO K K, RAMBABU G, et al. A wide-ranging review on Nasicon type materials. Journal of Materials Science, 2011,46(9):2821-2837.
[23] WANG X X, LIU Z H, TANG Y H, et al. Low temperature and rapid microwave sintering of Na3Zr2Si2PO12 solid electrolytes for Na-ion batteries. Journal of Power Sources, 2021,481:228924.
[24] GRADY Z M, TSUJI K, NDAYISHIMIYE A, et al. Densification of a solid-state NASICON sodium-ion electrolyte below 400 ℃ by cold sintering with a fused hydroxide solvent. ACS Applied Energy Materials, 2020,3(5):4356-4366.
[25] SHAO Y J, ZHONG G M, LU Y X, et al. A novel NASICON- based glass-ceramic composite electrolyte with enhanced Na-ion conductivity. Energy Storage Materials, 2019,23:514-521.
[26] LENG H Y, NIE J Y, LUO J. Combining cold sintering and Bi2O3-activated liquid-phase sintering to fabricate high-conductivity Mg-doped NASICON at reduced temperatures. Journal of Materiomics, 2019,5(2):237-246.
[27] OH J A S, HE L C, PLEWA A, et al. Composite NASICON (Na3Zr2Si2PO12) solid-state electrolyte with enhanced Na+ ionic conductivity: effect of liquid phase sintering. ACS Applied Materials & Interfaces, 2019,11(43):40125-40133.
[28] DA SILVA J G P, BRAM M, LAPTEV A M, et al. Sintering of a sodium-based NASICON electrolyte: a comparative study between cold, field assisted and conventional sintering methods. Journal of the European Ceramic Society, 2019,39(8):2697-2702.
[29] WANG H, OKUBO K, INADA M, et al. Low temperature- densified NASICON-based ceramics promoted by Na2O-Nb2O5-P2O5 glass additive and spark plasma sintering. Solid State Ionics, 2018,322:54-60.
[30] HUO H Y, GAO J, ZHAO N, et al. A flexible electron-blocking interfacial shield for dendrite-free solid lithium metal batteries. Nature Communications, 2021,12(1):176.
[31] JIA M Y, ZHAO N, HUO H Y, et al. Comprehensive investigation into garnet electrolytes toward application-oriented solid lithium batteries. Electrochemical Energy Reviews, 2020,3(4):656-689.
[32] ZHAO N, KHOKHAR W, BI Z J, et al. Solid garnet batteries. Joule, 2019,3(5):1190-1199.
[33] VERTRUYEN B, ESHRAGHI N, PIFFET C, et al. Spray-drying of electrode materials for lithium- and sodium-ion batteries. Materials, 2018,11(7):1076.
[34] KOU Z Y, MIAO C, WANG Z Y, et al. Novel NASICON-type structural Li1.3Al0.3Ti1.7SixP5(3-0.8x)O12 solid electrolytes with improved ionic conductivity for lithium ion batteries. Solid State Ionics, 2019,343:115090.
[35] SHEN L, YANG J, LIU G Z, et al. High ionic conductivity and dendrite-resistant NASICON solid electrolyte for all-solid-state sodium batteries. Materials Today Energy, 2021,20:100691.
[36] LI Y Q, WANG Z, LI C L, et al. Densification and ionic- conduction improvement of lithium garnet solid electrolytes by flowing oxygen sintering. Journal of Power Sources, 2014,248:642-646.